2022 Q1 Construction Industry Economic Outlook & Trends
We are excited to share our first edition of 2022 Construction Industry Economic Outlook & Analysis publication, which includes an analysis of current construction economics; permits, material, labor, and confidence in the market; and a market analysis derived from the most credible sources in our industry. The information can be viewed at a summary level, or you can dive deeper into the source material through the references provided.
Q1 2022 Market Analysis
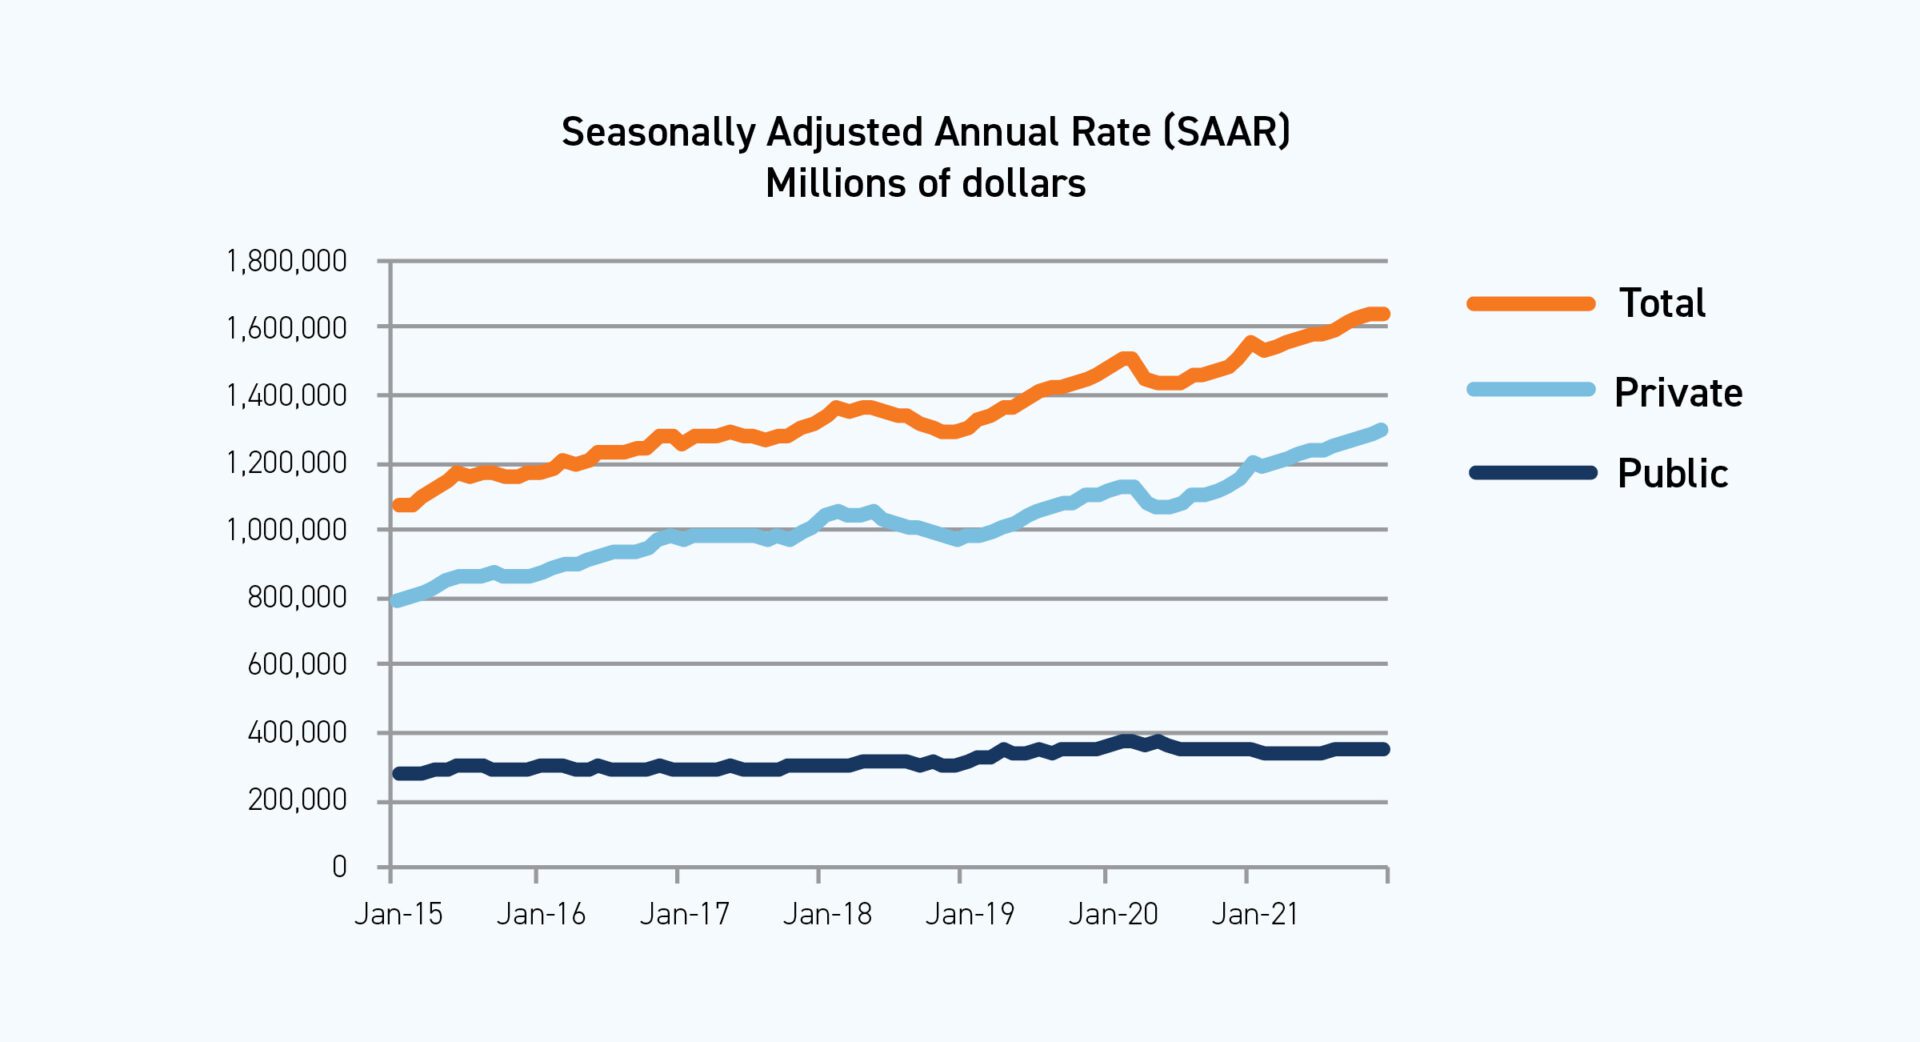
Total Construction Spending
Source: U.S. Census Bureau, February 1, 2022
Total Construction Spending
Source: FMI 2022 Engineering and Construction Industry Overview
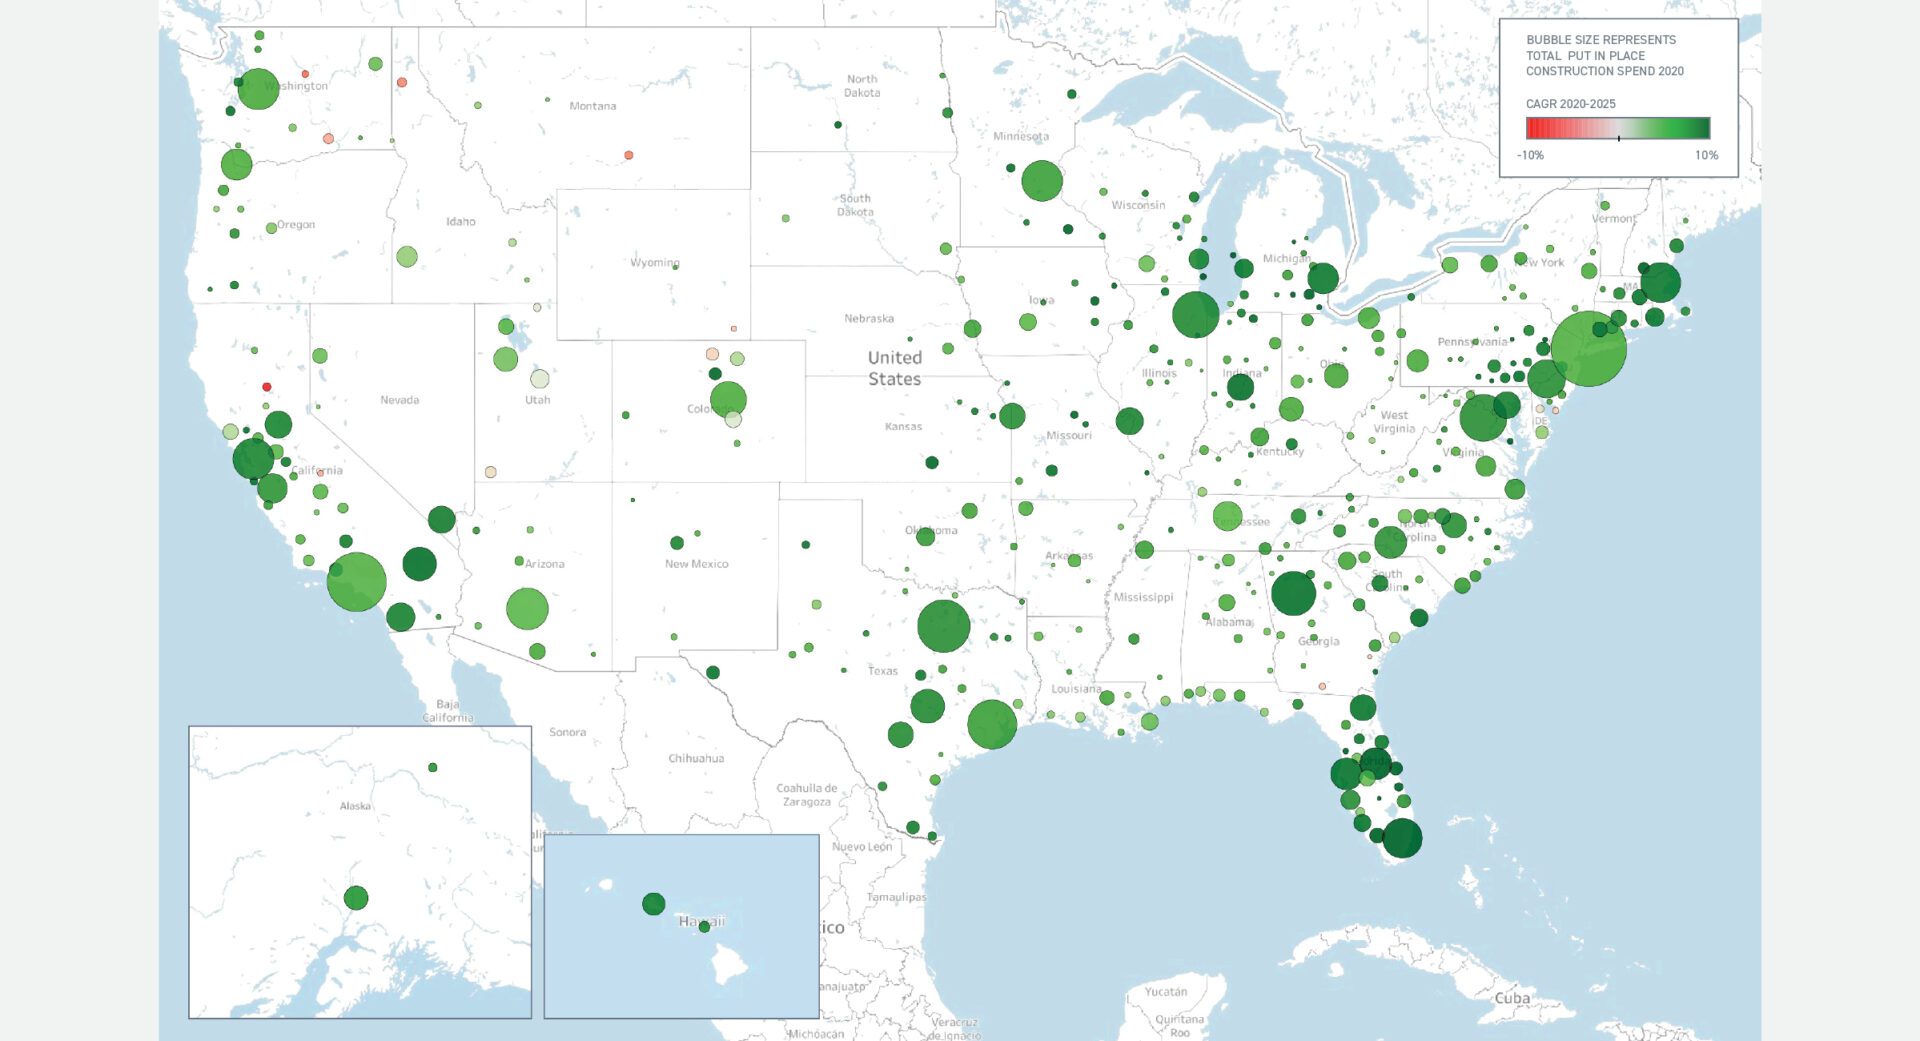
Total Construction Spending Put in Place 2020 and Forecast Growth (2020 through 2025) by Metropolitan Statistical Area.
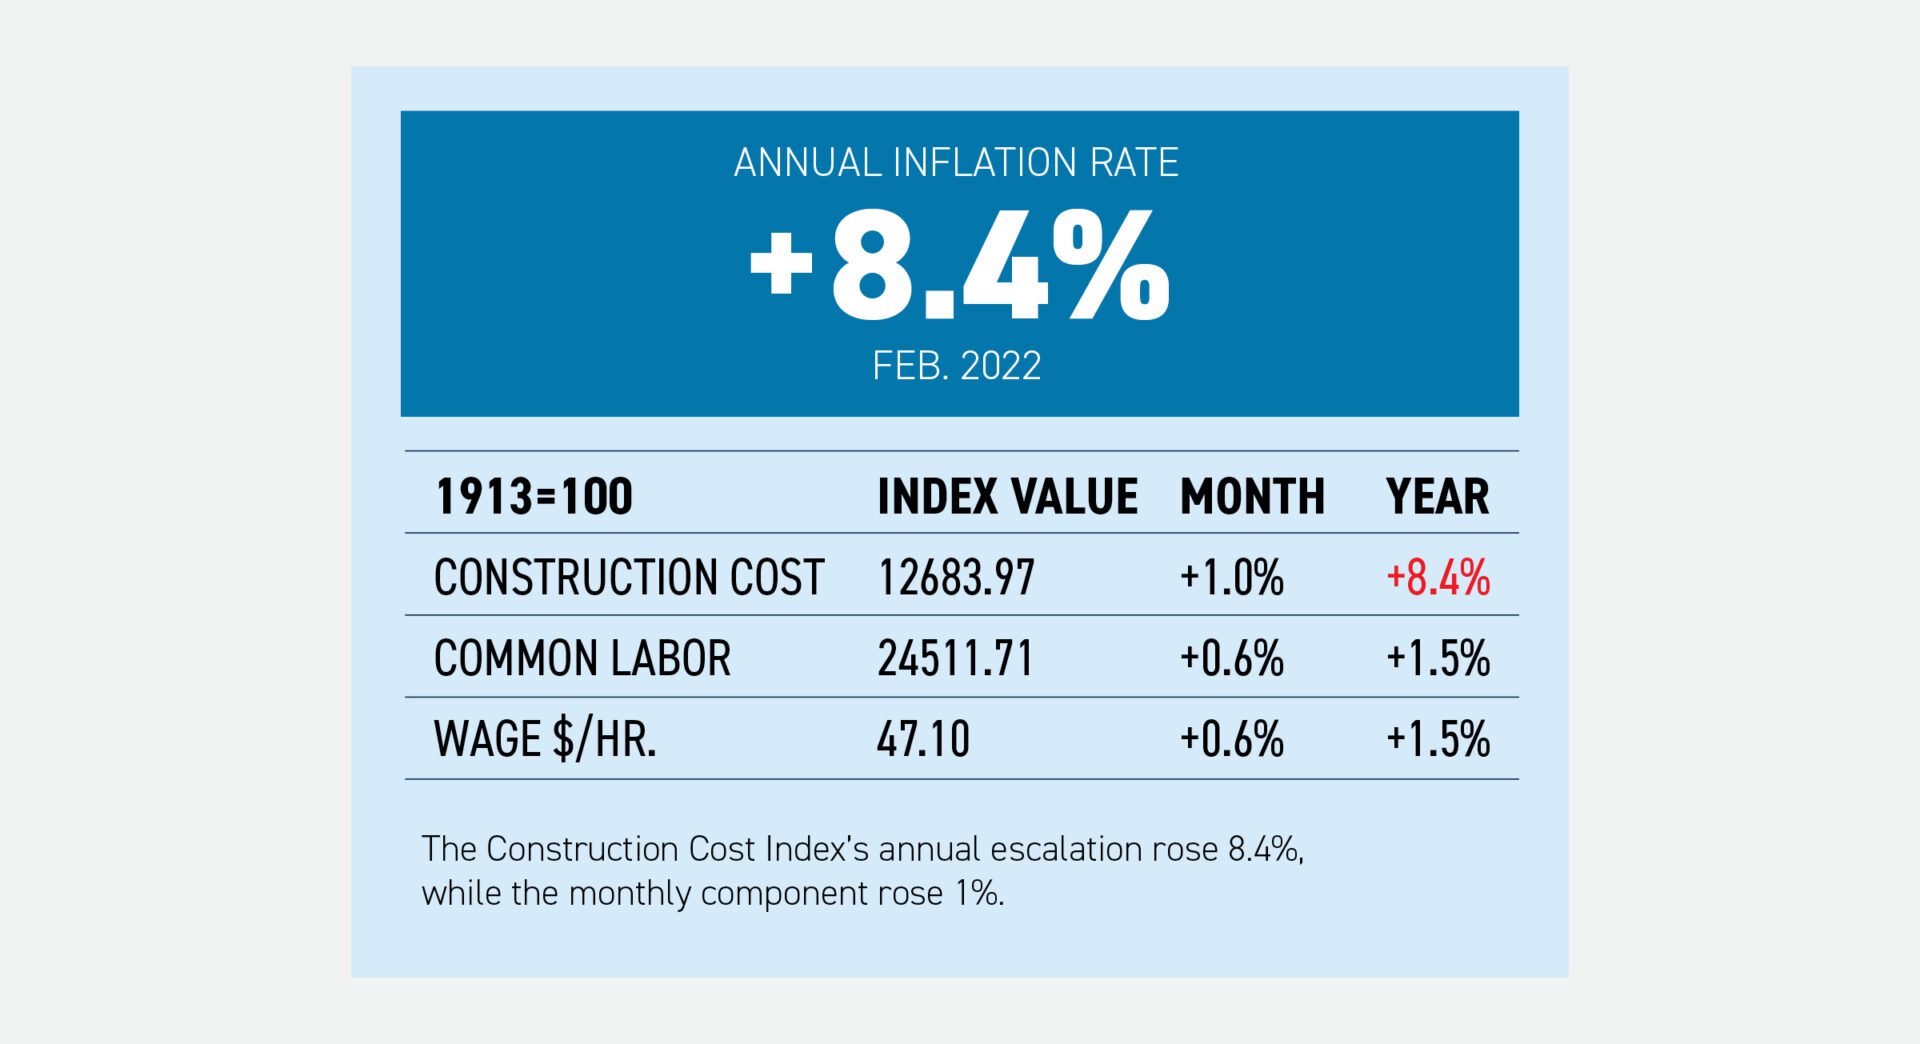
Construction Cost Index
Source: ENR
HOW ENR BUILDS THE INDEX
200 hours of common labor at the 20-city average of common labor rates, plus 25 cwt of standard structural steel shapes at the mill price prior to 1996 and the fabricated 20-city price from 1996, plus 1.128 tons of portland cement at the 20-city price, plus 1,088 board ft of 2 x 4 lumber at the 20-city price.
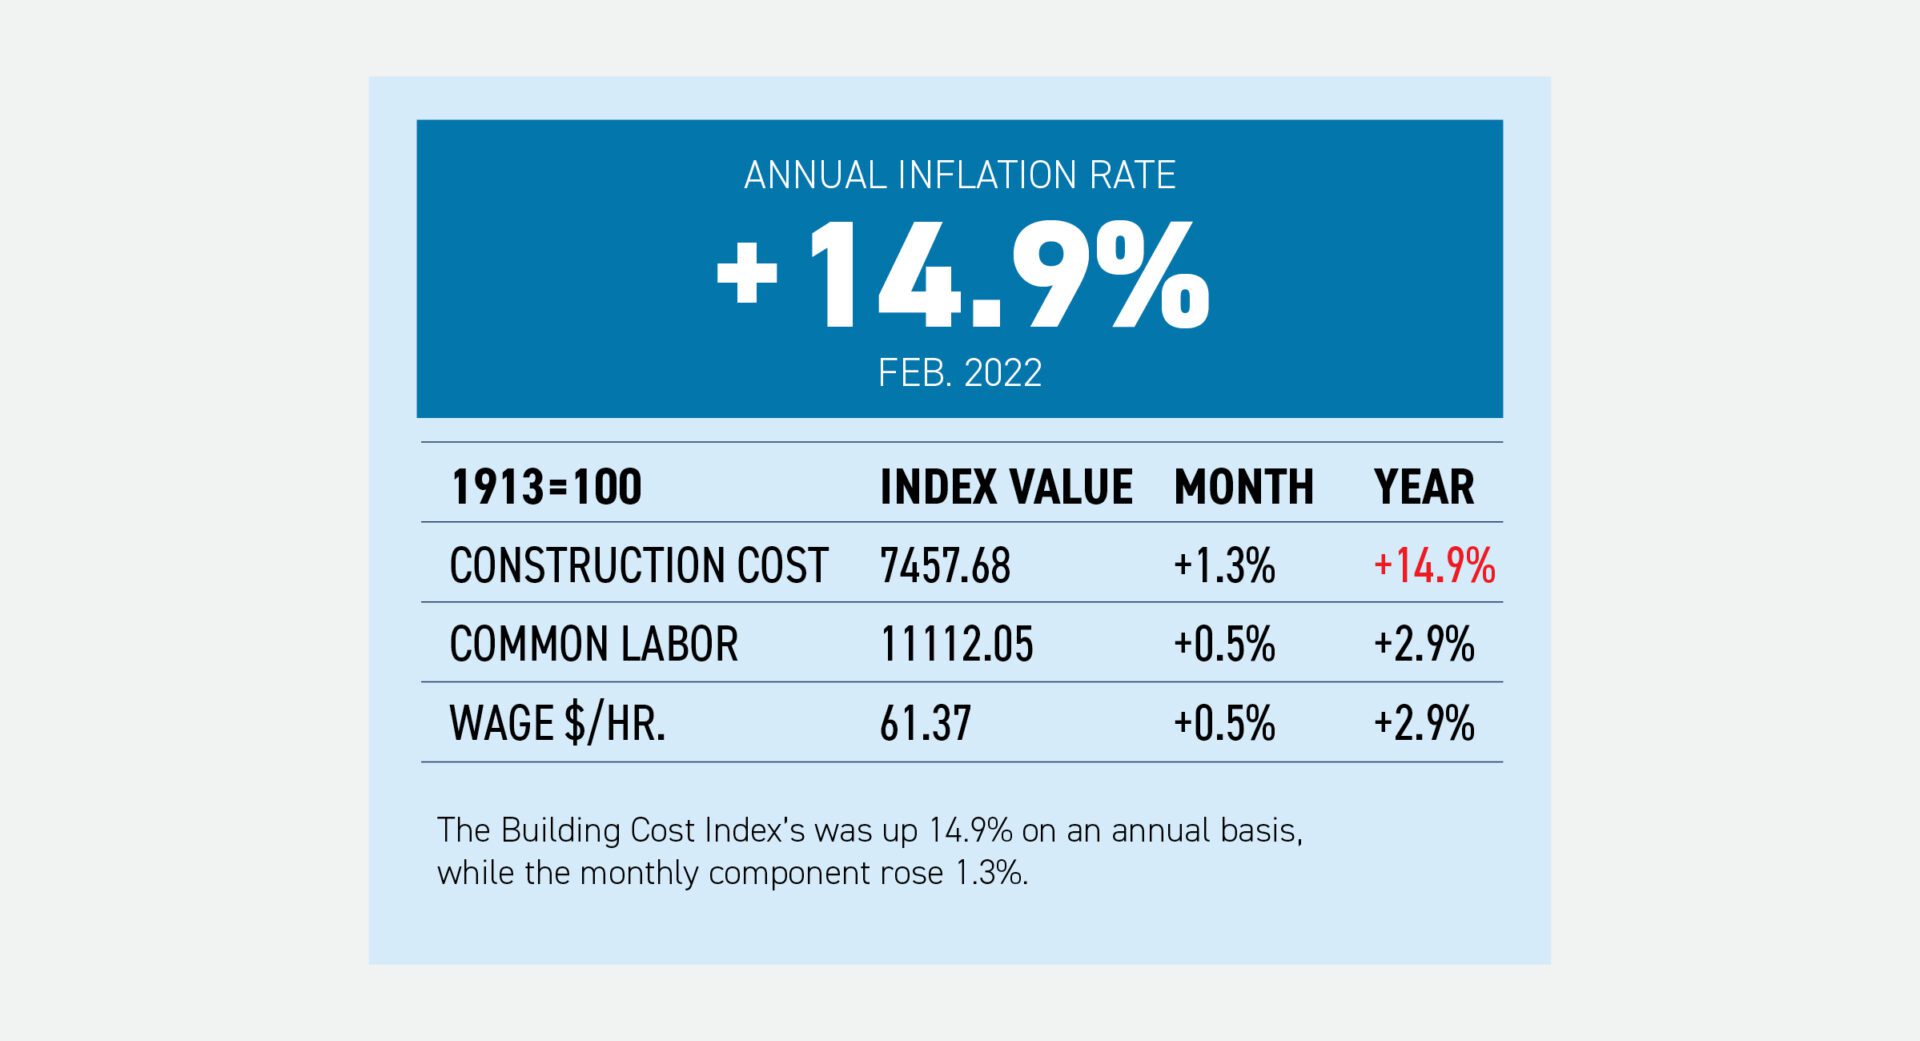
Building Cost Index
Source: ENR
HOW ENR BUILDS THE INDEX
68.38 hours of skilled labor at the 20-city average of bricklayers, carpenters and structural ironworkers rates, plus 25 cwt of standard structural steel shapes at the mill price prior to 1996 and the fabricated 20-city price from 1996, plus 1.128 tons of portland cement at the 20-city price, plus 1,088 board ft of 2 x
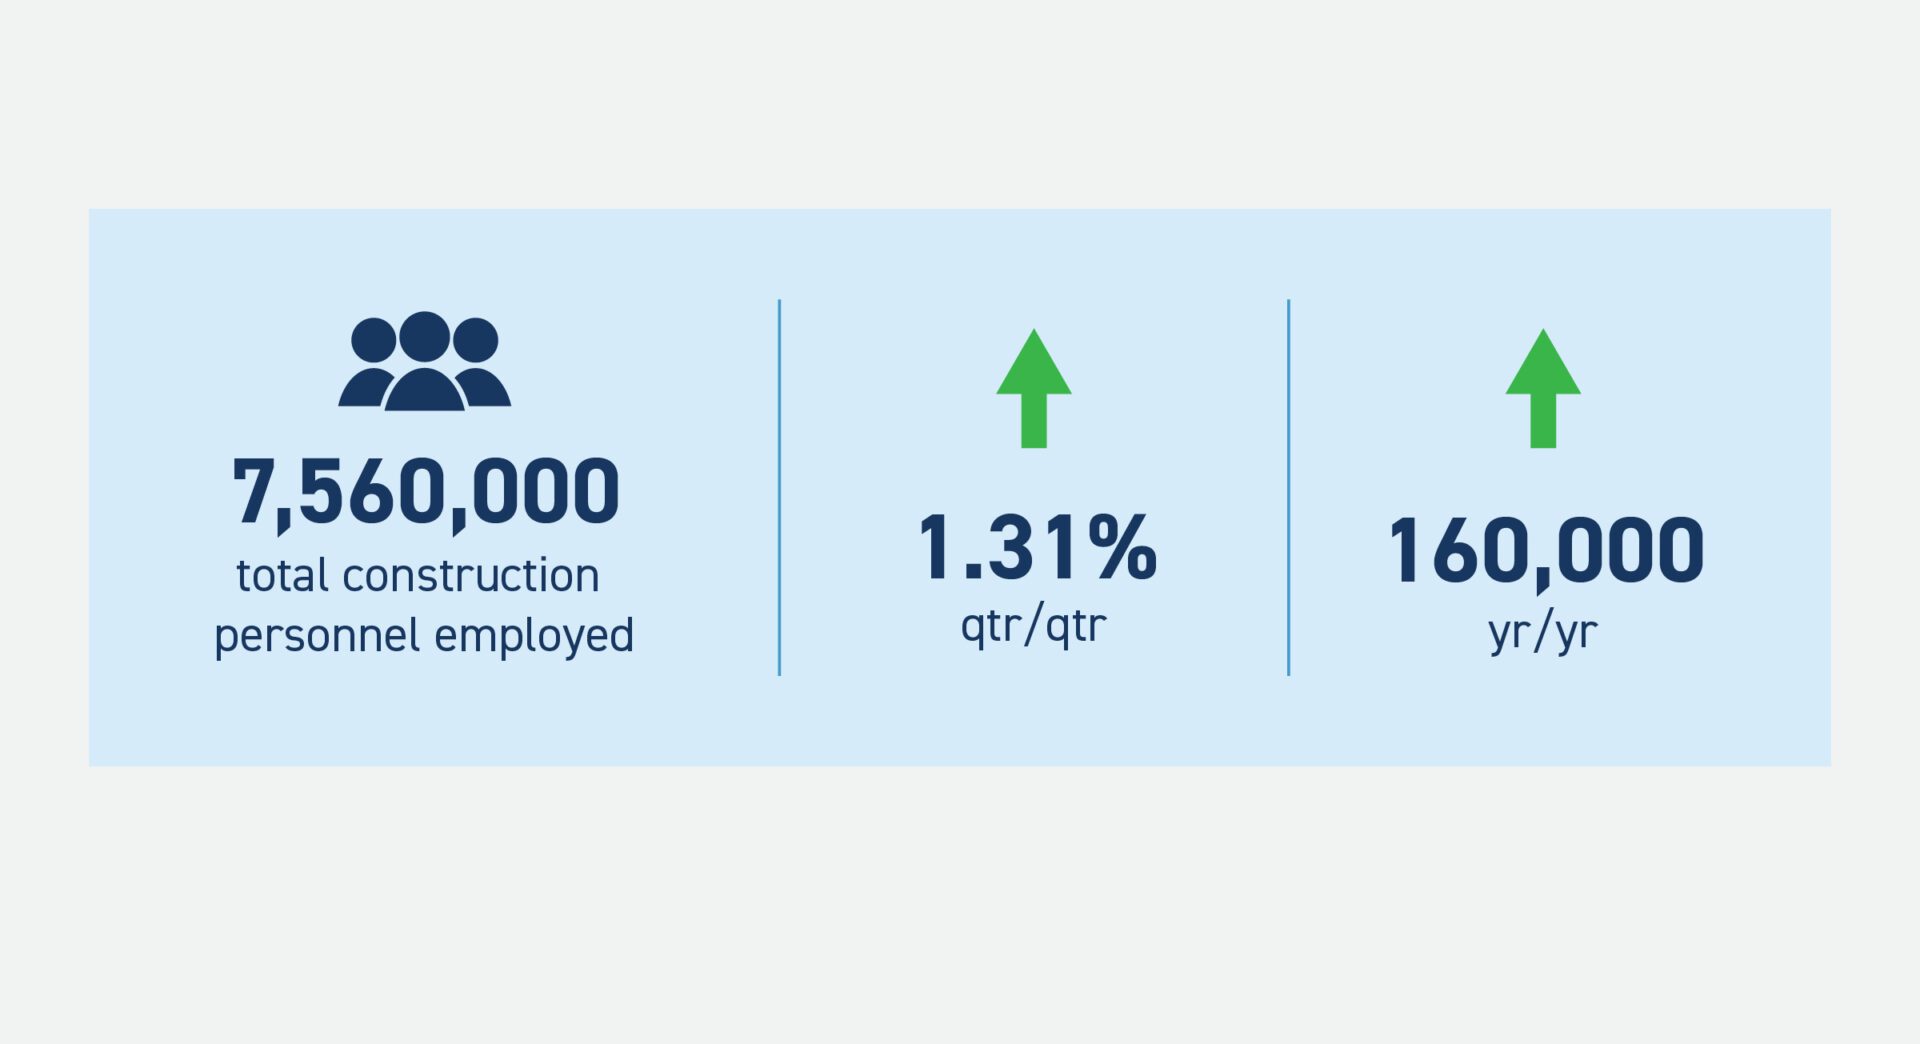
Total U.S. Construction Employment in December 2021
Source: U.S. Bureau of Labor Statistics
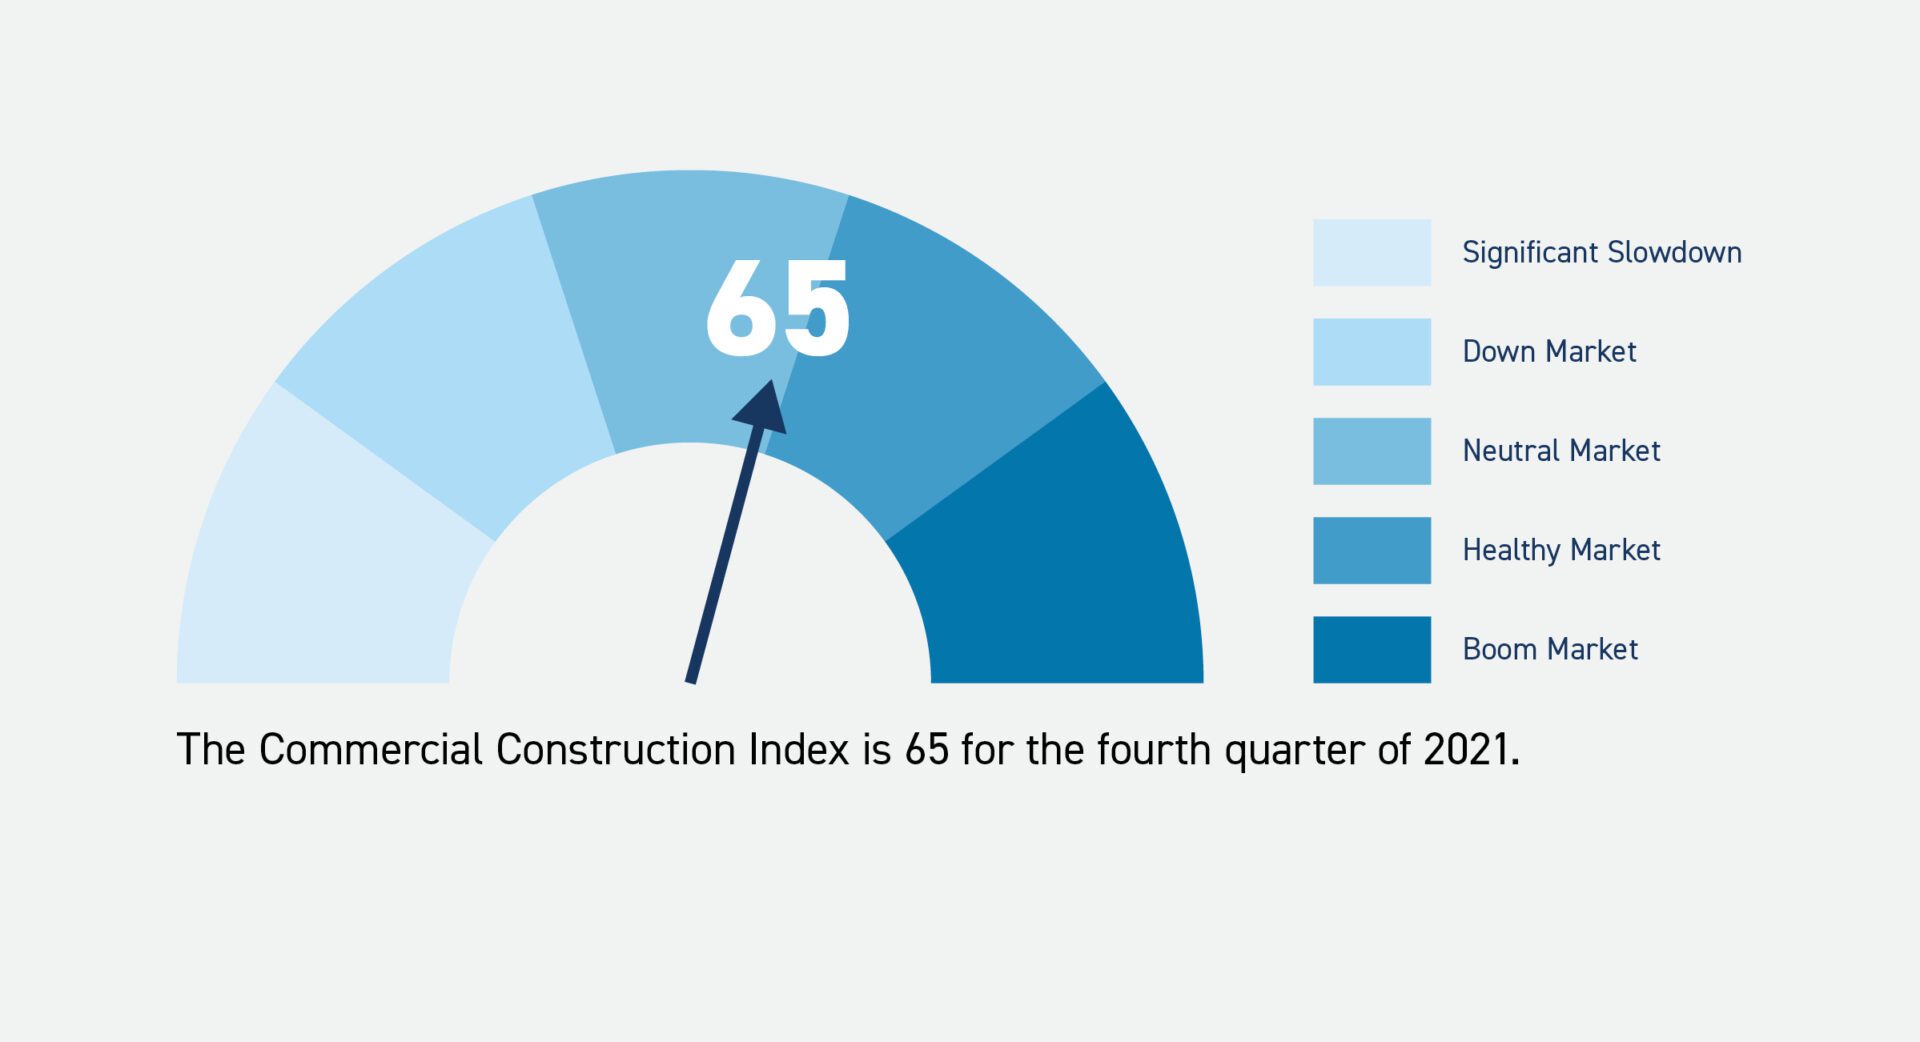
Construction Confidence
Source: U.S. Chamber of Commerce – Commercial Construction Index
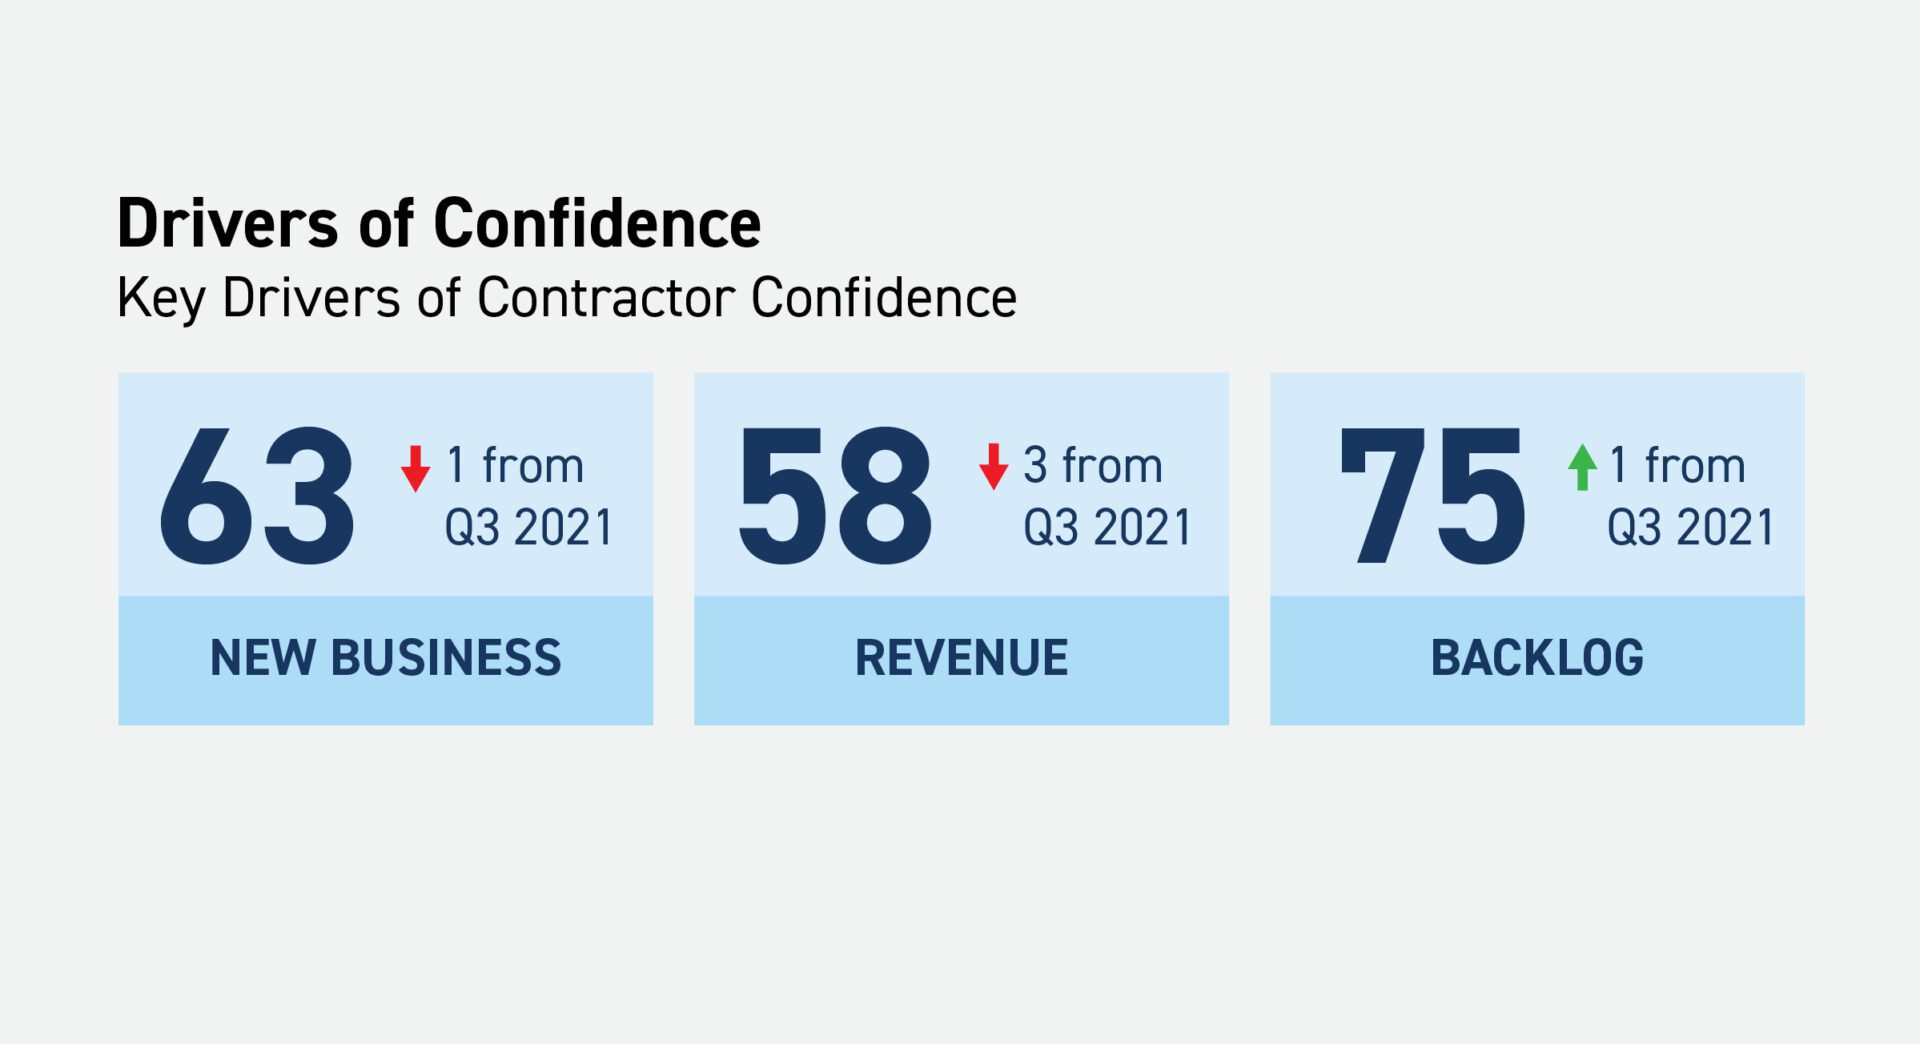
Drivers of Confidence
Key Drivers of Contractor Confidence
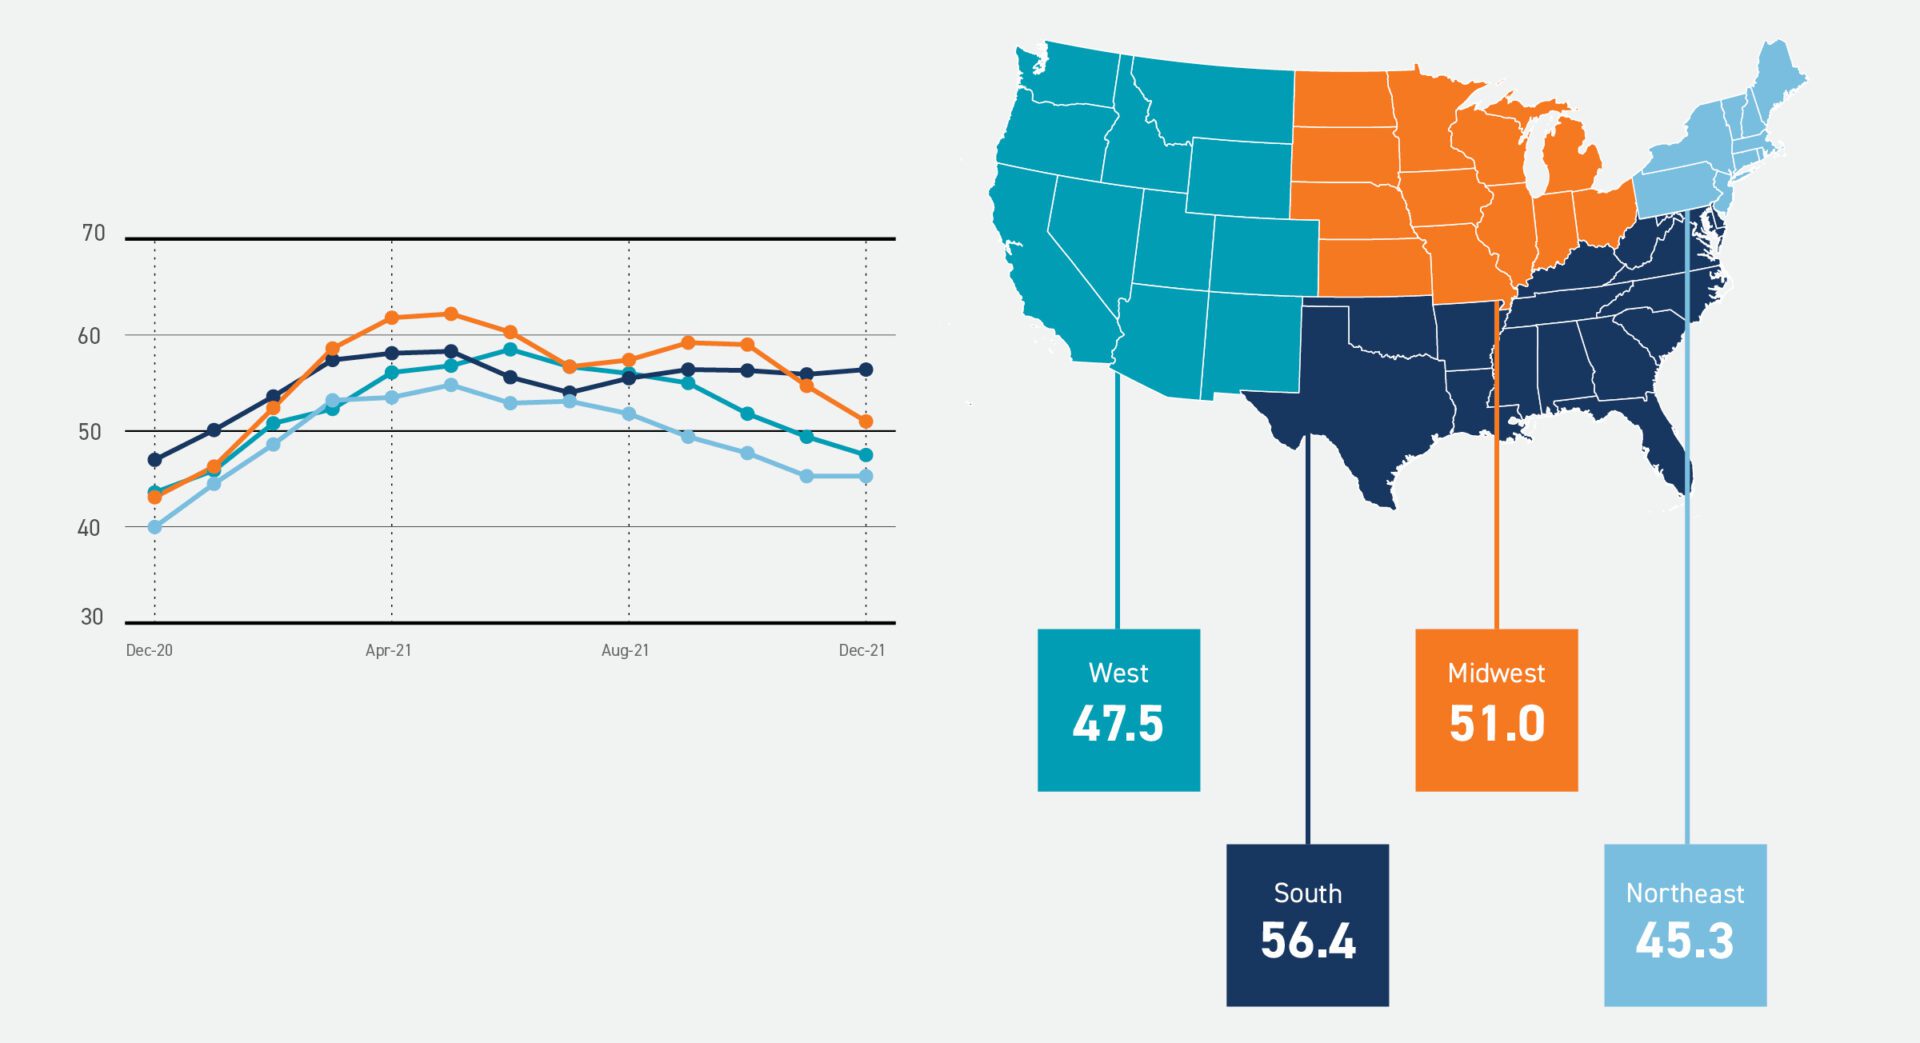
AIA Architectural Billings Index (ABI)
Source: AIA
The Architecture Billings index (ABI) is a leading economic indicator that leads nonresidential construction activity by approximately 9-12 months. A score of 50 equals no change from the previous month. Above 50 shows increase; below 50 shows decrease. 3-month moving average.
Business conditions strengthen at firms located in the South, but remain soft at firms in the Northeast and West.
Change in Residential Permit Authorizations December 2021/December 2020
Source: U.S. Census Bureau
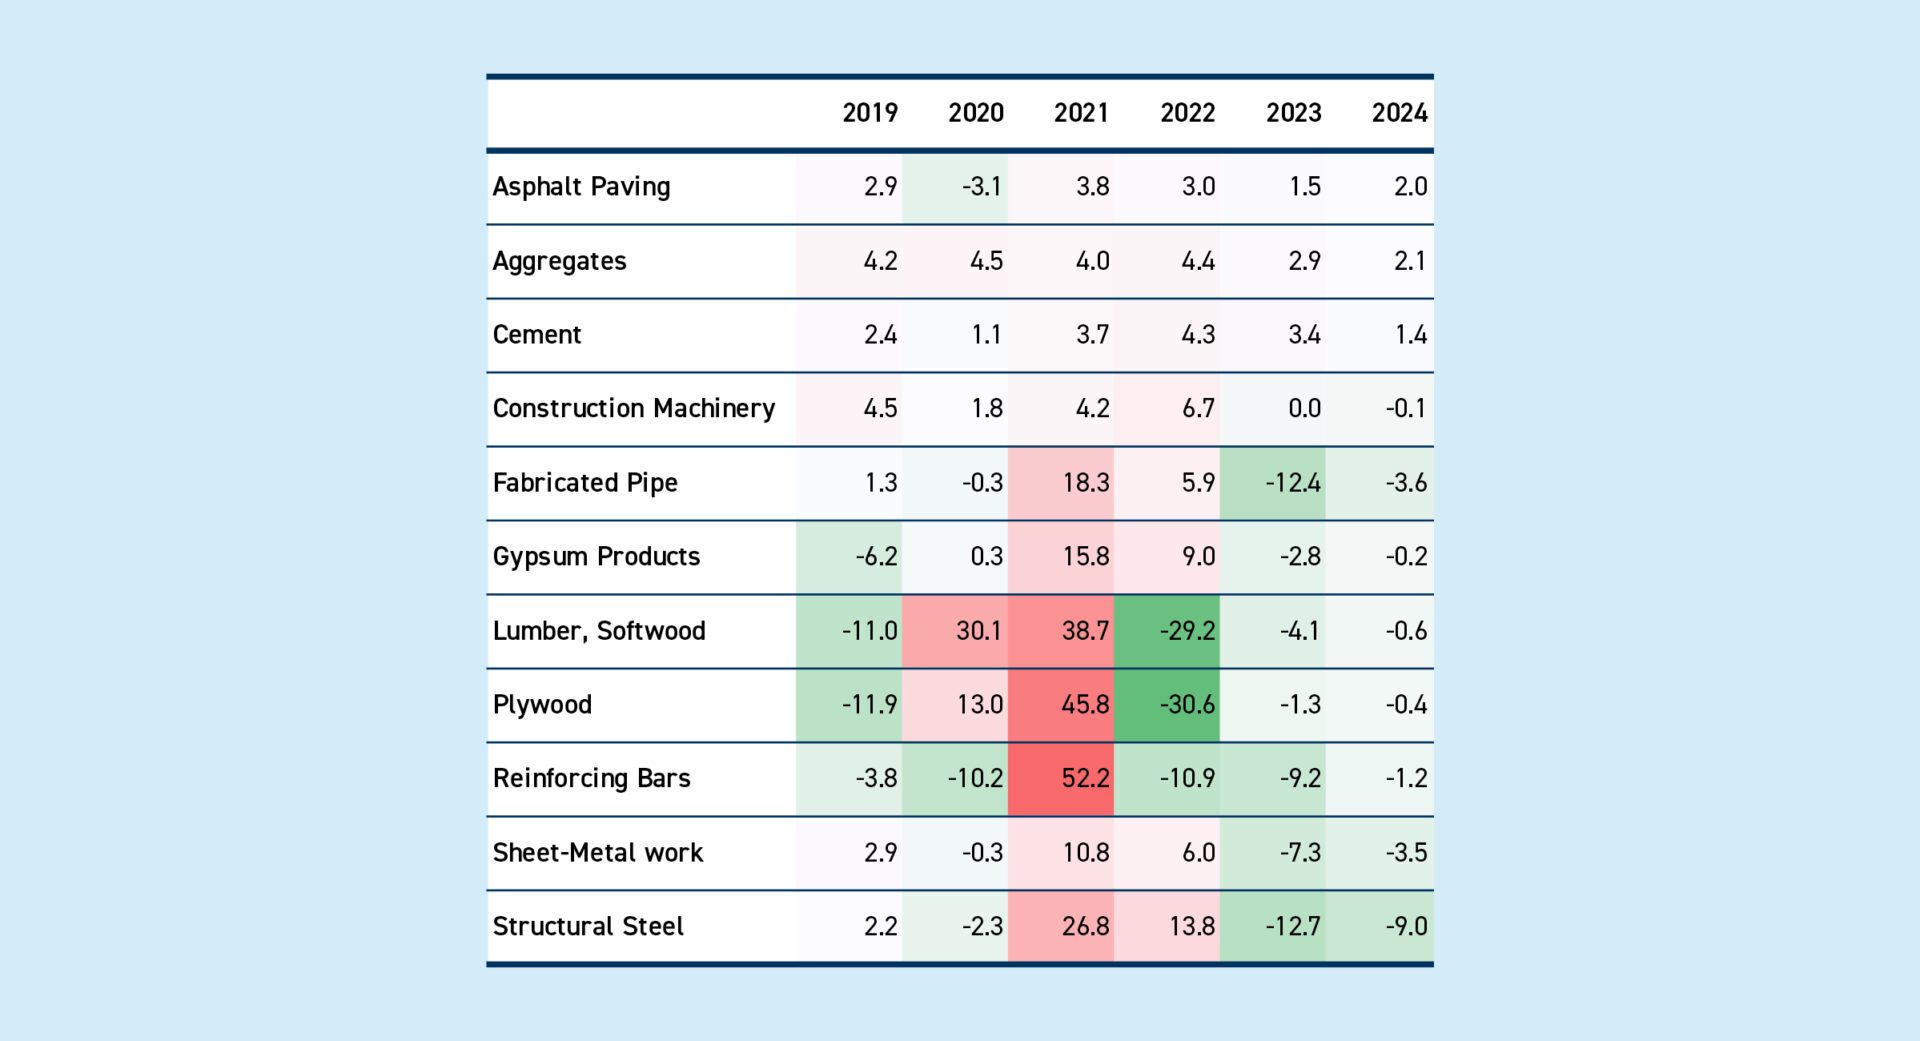
Material Price Inflation Through 2024
Sources: IHS Global Insights & ENR NOTE
Escalation are annual averages.

